
Solar Panel ROI Calculator: When Do They Pay for Themselves?
Calculate the payback period and return on investment of rooftop solar with a simple formula, a worked 3 kW example and the factors that shorten payback.
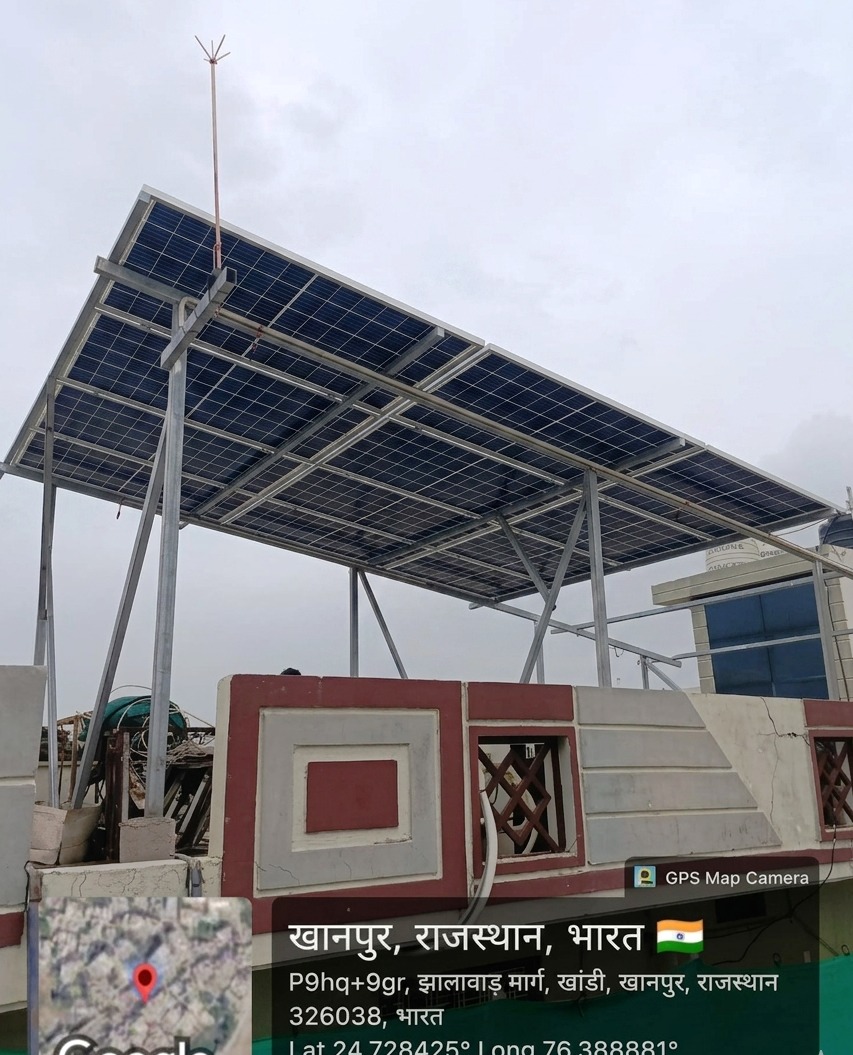
Rooftop solar is an investment, so it deserves an investor's question: when do I get my money back, and what do I earn after that? This guide shows how to calculate payback and return on investment for a home system, with a worked example you can adapt to your own bill.
The payback formula
Payback period is the time it takes for your savings to equal what you paid:
Payback period (years) = Net system cost ÷ Yearly savings
Where:
- Net system cost = system price − subsidies
- Yearly savings = monthly bill savings × 12
A worked example: 3 kW home system
| Item | Amount |
|---|---|
| System price | ₹1,95,000 |
| Central subsidy (PM Surya Ghar) | − ₹78,000 |
| State top-up (if eligible) | − ₹17,000 |
| Net cost | ₹1,00,000 |
| Generation | ~390 units/month |
| Tariff | ₹7.5 per unit |
| Yearly savings | ~₹35,000 |
Payback = ₹1,00,000 ÷ ₹35,000 ≈ 2.9 years.
Without the state top-up, the net cost is ₹1,17,000 and payback is about 3.3 years. For most subsidised home systems, payback falls in the 3–4 year range.
Return on investment over the system's life
After payback, the savings are effectively profit. Over 25 years:
- Total savings: ₹35,000 × 25 ≈ ₹8.75 lakh
- Minus net cost: ₹1,00,000
- Net gain: roughly ₹7.75 lakh
That equals a simple annual return far above what most savings instruments offer, and it comes as money you did not have to spend on electricity.
This example is deliberately conservative. It ignores tariff increases, which would raise savings, and assumes flat output, while real panels lose about 0.5% a year.
What shortens your payback
- Claiming every subsidy you qualify for. Central plus state support can cut the net cost dramatically.
- A higher tariff. The more you pay per unit, the more each solar unit saves. Homes in higher tariff slabs see faster payback.
- Correct sizing. A system matched to your consumption turns nearly every unit into savings.
- A shadow-free, clean array. More generation means more savings.
- Daytime usage. Using solar power directly avoids any settlement-rule losses.
What stretches your payback
- Paying for non-DCR panels and losing the subsidy
- Oversizing beyond your consumption
- Shade from tanks, walls or neighbouring buildings
- Loan interest, if you finance the system — see Solar Loan vs Cash vs Lease
- Batteries, which add cost without adding much saving on a stable grid
Payback by system size
Estimated with ₹7.5 per unit, full central subsidy and the ₹17,000 state top-up:
| System size | Net cost | Yearly savings | Payback |
|---|---|---|---|
| 1 kW | ~₹23,000 | ~₹9,000 | ~2.6 years |
| 3 kW | ~₹1,00,000 | ~₹35,000 | ~2.9 years |
| 5 kW | ~₹1,80,000 | ~₹58,000 | ~3.1 years |
Savings assume your consumption is at least as high as what the system generates. For numbers based on your own bill, use our solar savings calculator.
Frequently asked questions
What is a good payback period for rooftop solar?
For a subsidised home system, 3–4 years is typical and very good. Anything under 6 years still represents a strong return, given that panels last 25 years or more.
Does financing the system change the payback period?
Yes. Loan interest adds to your total cost and lengthens payback. However, if your monthly EMI is close to your monthly bill savings, the system can pay for itself from day one with little out of pocket.
Should I include future tariff increases in my calculation?
It is safer to plan without them. If tariffs rise, your returns simply get better. Planning on today's tariffs keeps your estimate conservative.
Is solar a better investment than a fixed deposit?
In pure return terms, a well-sized subsidised system typically earns far more than a fixed deposit rate. The trade-off is that your money is tied up in the system rather than being withdrawable, so only invest what you are comfortable committing for the long term.